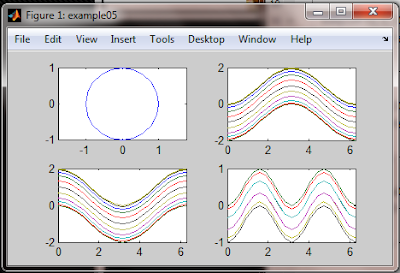
This example demonstrated on how to put more than one graph in one figure:
keyword:subplot
The code as following:
function shili05
h0=figure('toolbar','none',...
'position',[200 150 450 250],...
'name','example05');
t=0:pi/10:2*pi;
[x,y]=meshgrid(t);
subplot(2,2,1)
plot(sin(t),cos(t))
axis equal
subplot(2,2,2)
z=sin(x)-cos(y);
plot(t,z)
axis([0 2*pi -2 2])
subplot(2,2,3)
h=sin(x)+cos(y);
plot(t,h)
axis([0 2*pi -2 2])
subplot(2,2,4)
g=(sin(x).^2)-(cos(y).^2);
plot(t,g)
axis([0 2*pi -1 1])
function shili05%function name's shil05
h0=figure('toolbar','none',...%opening a figure
'position',[200 150 450 250],...
'name','example05');
t=0:pi/10:2*pi;%defining the t that is t=0, and plus pi/10 in each iteration until t=2 multiple pi
[x,y]=meshgrid(t);%from matlab help file
[X,Y] = meshgrid(x,y) transforms the domain specified by vectors x and y into arrays X and Y. The rows of the output array X are copies of the vector x;
columns of the output array Y are copies of the vector y.
example:
[X,Y] = meshgrid(1:3,10:14)
X =
1 2 3
1 2 3
1 2 3
1 2 3
1 2 3
Y =
10 10 10
11 11 11
12 12 12
13 13 13
14 14 14
subplot(2,2,1)%showing there should be 4 graphs,
2 rows and 2 columns.
Putting this graph at the top left indicated by 1
plot(sin(t),cos(t))
axis equal%axis of x and y is equal
subplot(2,2,2)%graph at top right
z=sin(x)-cos(y);
plot(t,z)
axis([0 2*pi -2 2])%x-axis from 0 to 2*pi; y-axis from -2 to 2
subplot(2,2,3)%graph at bottom left
h=sin(x)+cos(y);
plot(t,h)
axis([0 2*pi -2 2])%x-axis from 0 to 2*pi; y-axis from -2 to 2
subplot(2,2,4)%graph at bottom right
g=(sin(x).^2)-(cos(y).^2);
plot(t,g)
axis([0 2*pi -1 1])%x-axis from 0 to 2*pi; y-axis from -1 to 1
No comments:
Post a Comment