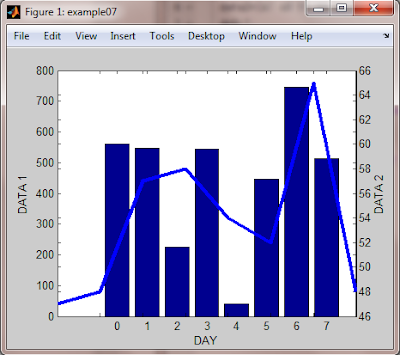
This example demonstrate how to plot line graph and bar graph.
here is the code, i done some modification to the graph.
function shili07
h0=figure('toolbar','none',...
'position',[200 150 450 350],...
'name','example07');
data1=[562 548 224 545 41 445 745 512];
data2=[47 48 57 58 54 52 65 48];
d=0:7;
bar(d,data1)
xlabel('DAY');
ylabel('DATA 1');
h1=gca;
h2=axes('position',get(h1,'position'));
plot(d,data2,'linewidth',3)
ylabel('DATA 2');
set(h2,'yaxislocation','right','color','none','xticklabel',[])
explanation as follow:
function shili07%function's name shili07
h0=figure('toolbar','none',...%opening a figure
'position',[200 150 450 350],...%the grid position and the figure size
'name','example07');%figure' name
data1=[562 548 224 545 41 445 745 512];
data2=[47 48 57 58 54 52 65 48];
d=0:7;%d=0,1,2,3,4,5,6,7
bar(d,data1)%draw the bar
xlabel('DAY');%name the x-axis "DAY"
ylabel('DATA 1');%name the y-axis "DATA1"
h1=gca;%h1=get the current axis position
h2=axes('position',get(h1,'position'));%not so sure; getting the h1 current axes and pass to h2.
plot(d,data2,'linewidth',3)%plotting the line graph; line thickness should be 3
ylabel('DATA 2');%labeling the y-axis "DATA 2"
set(h2,'yaxislocation','right','color','none','xticklabel',[])%explanation from matlab help file
To ensure that the second axes does not interfere with the first, locate the y-axis on the right side of the axes, make the background transparent, and set the second axes' x tick marks to the empty matrix
Matlab graph plotting
Wednesday, June 22, 2011
Tuesday, June 21, 2011
example 6
This example show to find the maximum and minimum point.
Also how to label both points.
here is the code; just copy and paste at m-file, save it and run it.
function shili06
h0=figure('toolbar','none',...
'position',[200 150 450 400],...
'name','example06');
t=0:pi/10:2*pi;
h=plot(t,sin(t));
xlabel('t=0 to 2*pi','fontsize',16);
ylabel('sin(t)','fontsize',16);
title('\it{0 to2\pi}','fontsize',16)
x=get(h,'xdata');
y=get(h,'ydata');
imin=find(min(y)==y);
imax=find(max(y)==y);
text(x(imin),y(imin),...
['\leftarrow=',num2str(y(imin))],...
'fontsize',15)
text(x(imax),y(imax),...
['\leftarrow=',num2str(y(imax))],...
'fontsize',15)
Explanation as follow:
function shili06%function's name that is shili06
h0=figure('toolbar','none',...%opening a figure
'position',[200 150 450 400],...%figure properties
'name','example06');%figure name
t=0:pi/10:2*pi;%defining value for t
h=plot(t,sin(t));%plotting the graph; x=t, y=sin(t)
xlabel('t=0 to 2*pi','fontsize',16);%labeling on x-axis; name="t=0 to 2*pi"; fontsize=16.
ylabel('sin(t)','fontsize',16);%labeling on y-axis; name="sin(t)"; fontsize=16.
title('\it{0 to2\pi}','fontsize',16)%the title of graph="0 to pi";it=italic and allowing for greek %symbol; fontsize=16
x=get(h,'xdata');%this i not so sure but i think is getting all the values of x from h
y=get(h,'ydata');%this i also not so sure but i think is getting all the values of y from h
imin=find(min(y)==y);%find=is to find the non-zero element;min(y)==y is to tell the find to %look for smallest element.
imax=find(max(y)==y);%find=is to find the non-zero element;max(y)==y is to tell the find to %look for biggest element.
text(x(imin),y(imin),...%indicating where the location of text should be.
['\leftarrow=',num2str(y(imin))],...%pointing the arrow to left, convert the number of "y minimum" to string
'fontsize',15)%fontsize=15
text(x(imax),y(imax),...%indicating where the location of text should be.
['\leftarrow=',num2str(y(imax))],...%pointing the arrow to left, convert the number of "y maximum" to string
'fontsize',15)%fontsize=15
%remark:In matlab, number need to converted to string, then only it can be displayed.
Monday, June 20, 2011
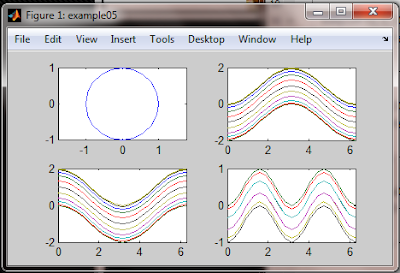
This example demonstrated on how to put more than one graph in one figure:
keyword:subplot
The code as following:
function shili05
h0=figure('toolbar','none',...
'position',[200 150 450 250],...
'name','example05');
t=0:pi/10:2*pi;
[x,y]=meshgrid(t);
subplot(2,2,1)
plot(sin(t),cos(t))
axis equal
subplot(2,2,2)
z=sin(x)-cos(y);
plot(t,z)
axis([0 2*pi -2 2])
subplot(2,2,3)
h=sin(x)+cos(y);
plot(t,h)
axis([0 2*pi -2 2])
subplot(2,2,4)
g=(sin(x).^2)-(cos(y).^2);
plot(t,g)
axis([0 2*pi -1 1])
function shili05%function name's shil05
h0=figure('toolbar','none',...%opening a figure
'position',[200 150 450 250],...
'name','example05');
t=0:pi/10:2*pi;%defining the t that is t=0, and plus pi/10 in each iteration until t=2 multiple pi
[x,y]=meshgrid(t);%from matlab help file
[X,Y] = meshgrid(x,y) transforms the domain specified by vectors x and y into arrays X and Y. The rows of the output array X are copies of the vector x;
columns of the output array Y are copies of the vector y.
example:
[X,Y] = meshgrid(1:3,10:14)
X =
1 2 3
1 2 3
1 2 3
1 2 3
1 2 3
Y =
10 10 10
11 11 11
12 12 12
13 13 13
14 14 14
subplot(2,2,1)%showing there should be 4 graphs,
2 rows and 2 columns.
Putting this graph at the top left indicated by 1
plot(sin(t),cos(t))
axis equal%axis of x and y is equal
subplot(2,2,2)%graph at top right
z=sin(x)-cos(y);
plot(t,z)
axis([0 2*pi -2 2])%x-axis from 0 to 2*pi; y-axis from -2 to 2
subplot(2,2,3)%graph at bottom left
h=sin(x)+cos(y);
plot(t,h)
axis([0 2*pi -2 2])%x-axis from 0 to 2*pi; y-axis from -2 to 2
subplot(2,2,4)%graph at bottom right
g=(sin(x).^2)-(cos(y).^2);
plot(t,g)
axis([0 2*pi -1 1])%x-axis from 0 to 2*pi; y-axis from -1 to 1
Sunday, June 19, 2011
example 4
this example plot 2 graphs in one figure and y-axis labeling is at both side of figure.
here is the code
function shili04
h0=figure('toolbar','none',...
'position',[200 150 450 250],...
'name','example4');
x=0:900;b=0.005;
y1=2*x;
y2=cos(b*x);
[h,~,~]=plotyy(x,y1,x,y2,'semilogy','plot');
axes(h(1))
ylabel('semilog plot');
axes(h(2))
ylabel('linear plot');
function shili04%function name shili04
h0=figure('toolbar','none',...
'position',[200 150 450 250],...
'name','example4');
x=0:900;b=0.005;%define constant; x is starting from 0 then increase 1 until 900; b is =0.005
y1=2*x;%y1 is equal to 2 multiply x
y2=cos(b*x);%y2 is b multiply x then cosine it
[h,~,~]=plotyy(x,y1,x,y2,'semilogy','plot');%main function that allow 2 kinds of y-axes labeling
here is some explanation found from matlab help file about plotyy
PLOTYY Graphs with y tick labels on the left and right
PLOTYY(X1,Y1,X2,Y2) plots Y1 versus X1 with y-axis labeling
on the left and plots Y2 versus X2 with y-axis labeling on
the right.
[AX,H1,H2] = PLOTYY(...) returns the handles of the two axes created in
AX and the handles of the graphics objects from each plot in H1
and H2. AX(1) is the left axes and AX(2) is the right axes.
axes(h(1))%handle the left axes
ylabel('semilog plot');%label the left axes semilog plot
axes(h(2))%handle the right axes
ylabel('linear plot');%label the right axes linear plot
Saturday, June 18, 2011
example 3
The above example showing how to put 2 graphs in one figure.
The code is as follow:
function shili03
h0=figure('toolbar','none',...
'position',[200 150 450 350],...
'name','example03');
x=-pi:0.05:pi;
y1=sin(x);
y2=cos(x);
plot(x,y1,...
'-*r',...
x,y2,...
'--og');
grid on
xlabel('X');
ylabel('Y');
title('Plotting 2 graph in one figure');
function shili03%function's name is shili03
h0=figure('toolbar','none',...
'position',[200 150 450 350],...
'name','example03');
x=-pi:0.05:pi;
y1=sin(x);
y2=cos(x);
plot(x,y1,...%this is the main point of the tutorial;1st plot x with respect to y1
'-*r',...%this is the sin(x) graph line properties
x,y2,...%2nd plot x with respect to y2
'--og');%this is the cos(x) graph line properties
grid on
xlabel('X');
ylabel('Y');
title('Plotting 2 graph in one figure');
Friday, June 17, 2011
example 2
The above example showing how change the characteristic of line (like colour, line weight...)
And here is the code:
function shili02
h0=figure('toolbar','none',...
'position',[200 150 450 350],...
'name','example2');
x=-pi:0.05:pi;
y=sin(x)+cos(x);
plot(x,y,'-*r','linewidth',1);
grid on
xlabel('×');
ylabel('Y');
title('y=sin(x)+cos(x)');
function shili02 %this indicate the function's name is shili02
h0=figure('toolbar','none',... %
'position',[200 150 450 350],...%opening a figure window and manipulate the figure
'name','example2');% properties (further detail see example 1)
x=-pi:0.05:pi; %x=-3.14159265, then adding -3.14159265+0.05, continue the adding 0.05 %until x=3.14159265
y=sin(x)+cos(x);
plot(x,y,'-*r','linewidth',1);%plotting x and y but letting the line making of * and red in colour
% and the line width is 1
you can change the '-*r' according to below reference
- solid
: dotted
-. dashdot
-- dashed
(none) no line
o circle
x x-mark
+ plus
* star
s square
d diamond
v triangle (down)
^ triangle (up)
< triangle (left)
> triangle (right)
p pentagram
h hexagram
b = blue
g = green
r = red
c = cyan
m = magenta
y = yellow
k = black
w = white
grid on
xlabel('×'); % labeling X the graph at x axis; you can change the name 'X' to anything you like
ylabel('Y'); %labeling Y the graph at Y axis; you can change the name 'Y' to anything you like
title('y=sin(x)+cos(x)'); %title of the graph, that is y=sin(x)+cos(x)
Thursday, June 16, 2011
Matlab graph plotting example1
1st of all, I am not the person who wrote the code; I found the code in one china forum.
In my point of view, the code is simple and very useful for the beginner who just starting at matlab programming.
The above example is generating a sine wave using the matlab m-file.
below is the code,
function shili01
h0=figure('toolbar','none',...
'position',[198 56 350 300],...
'name','example1');
x=-pi:0.05:pi;
y=sin(x);
plot(x,y);
xlabel('X');
ylabel('Y');
title('SIN( )');
grid on
here is the explanation, the above code is runnable, just copy to m-file, save it, and run it.
function shili01 % this indicate the function's name is shili01
h0=figure('toolbar','none',... % figure is to open above window
'position',[198 56 350 300],...%position is the figure size [left, bottom, width, height]
%(195=left, 56=bottom, 350=width, 300 =height)
'name','example1');%giving the figure a name=example 1
x=-pi:0.05:pi; %x=-3.14159265, then adding -3.14159265+0.05, continue the adding until %x=3.14159265
y=sin(x);%mathematical function of sine
plot(x,y);%plotting the graph
xlabel('X');%labeling X the graph at x axis; you can change the name 'X' to anything you like
ylabel('Y');%labeling Y the graph at y axis; you can change the name 'Y' to anything you like
title('SIN( )');%title of the graph, that is SIN()
grid on%you can try change grid on to grid off to see the different
I also a beginner in matlab,
so please tell me if my explanation is wrong.
Subscribe to:
Posts (Atom)