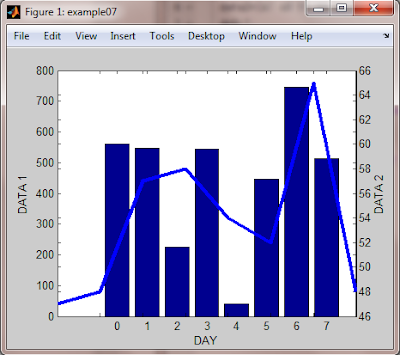
 This example demonstrate how to plot line graph and bar graph.
here is the code, i done some modification to the graph.
function shili07
h0=figure('toolbar','none',...
'position',[200 150 450 350],...
'name','example07');
data1=[562 548 224 545 41 445 745 512];
data2=[47 48 57 58 54 52 65 48];
d=0:7;
bar(d,data1)
xlabel('DAY');
ylabel('DATA 1');
h1=gca;
h2=axes('position',get(h1,'position'));
plot(d,data2,'linewidth',3)
ylabel('DATA 2');
set(h2,'yaxislocation','right','color','none','xticklabel',[])
explanation as follow:
function shili07%function's name shili07
h0=figure('toolbar','none',...%opening a figure
'position',[200 150 450 350],...%the grid position and the figure size
'name','example07');%figure' name
data1=[562 548 224 545 41 445 745 512];
data2=[47 48 57 58 54 52 65 48];
d=0:7;%d=0,1,2,3,4,5,6,7
bar(d,data1)%draw the bar
xlabel('DAY');%name the x-axis "DAY"
ylabel('DATA 1');%name the y-axis "DATA1"
h1=gca;%h1=get the current axis position
h2=axes('position',get(h1,'position'));%not so sure; getting the h1 current axes and pass to h2.
plot(d,data2,'linewidth',3)%plotting the line graph; line thickness should be 3
ylabel('DATA 2');%labeling the y-axis "DATA 2"
set(h2,'yaxislocation','right','color','none','xticklabel',[])%explanation from matlab help file
To ensure that the second axes does not interfere with the first, locate the y-axis on the right side of the axes, make the background transparent, and set the second axes' x tick marks to the empty matrix
No comments:
Post a Comment